What a Tactical Investment Approach Can Do for a Portfolio?
S&P 500 Drawdowns Since Great Depression
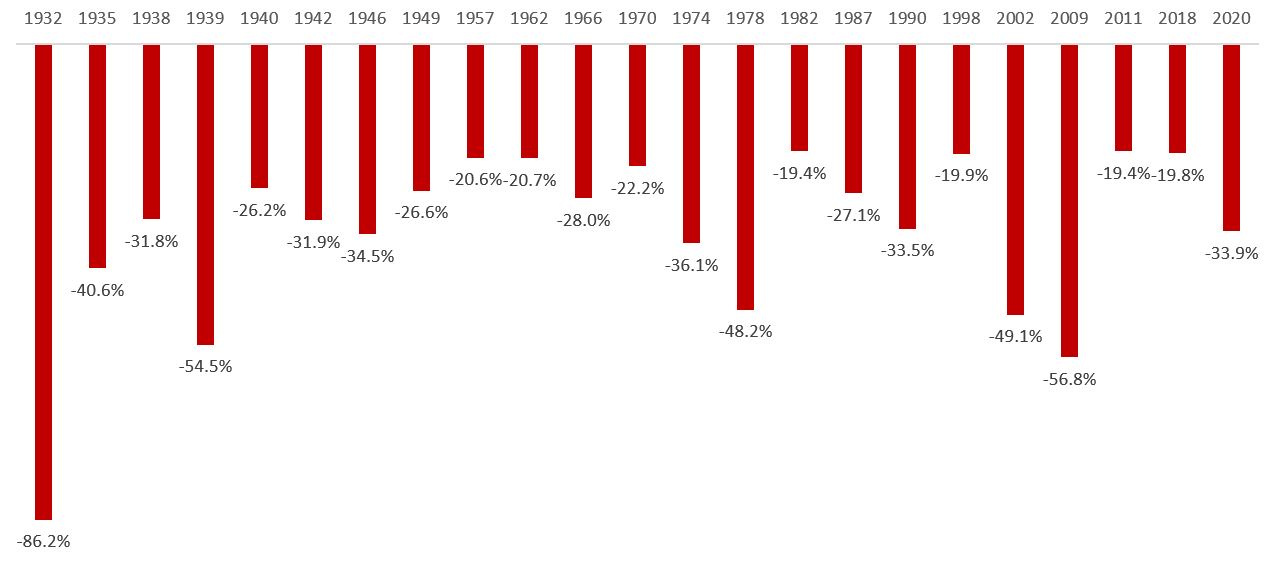
Source: Data collected from Factset. Date represented on chart marks the bottom of the drawdown. Performance displayed represents past performance, which is no guarantee of future results.
Over the course of our 15+ years as a client-focused asset manager, the element of behavioral investing is a constant. Emotions ebb n flow when one’s future is on the line – fear and greed can drive decision making. Having a balanced, strategic approach to asset allocation can limit the stress of the investing process, and also significantly reduce the urge for rash and potentially detrimental decision-making.
At Crosspoint, we understand that life is not lived in 30-year increments. A forward-looking chart demonstrating long-term wealth accumulation doesn’t demonstrate the traumatic experience of having years of life savings eliminated in a matter of weeks. At times when opportunity might be greatest, an investor’s psyche may be completely broken.
By focusing our data-driven, rules-based approach on capital preservation as well as long-term compounding, we can aid any portfolio in avoiding the pressure and consequences of emotional investing.
|
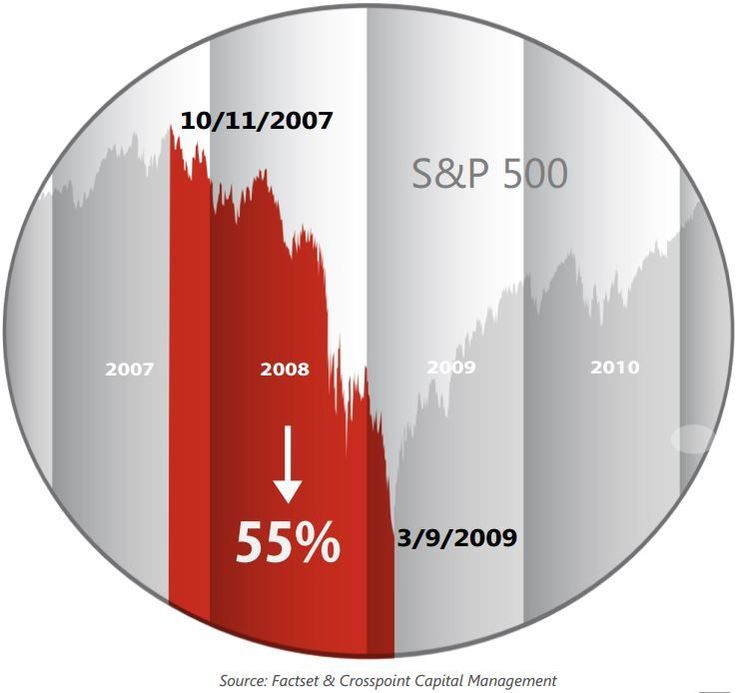
Preserving Capital During Market Downturns The market endured a staggering draw-down of 55% in the S&P 500 from October 11, 2007 to March 9, 2009. This means that S&P 500 needed to generate a return of 122% to recoup all of its losses. These types of major market downturns can put investor goals significantly off-track, including delaying retirement plans. At Crosspoint, our Tactical All-Cap strategy was only down 1% during this same period of time.* Our model helped avoid this market downturn by shifting down market exposure. This allowed us to grow investor capital from a much higher base instead of needing to recoup heavy losses. All of our strategies adhere to principals of capital preservation, similar to the Tactical All-Cap strategy. *This claim refers to all clients that were allocated to the Tactical All-Cap strategy from October 11, 2007 to March , 2009. |